ARC Public Summary
← All assets Class A Class A · pure A SC Resilient

BTC

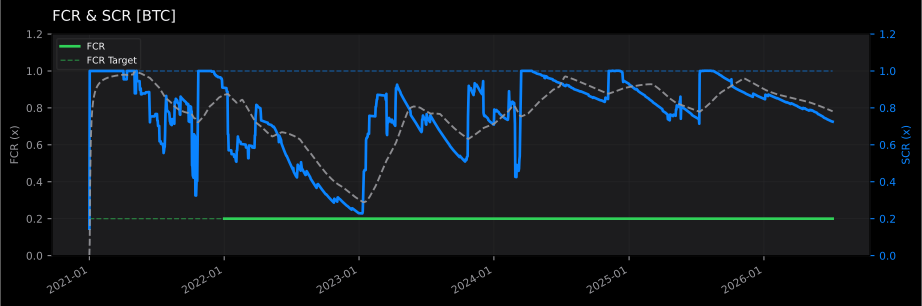
Net VMR closes at 1.76x, the OFL increase gate stays open for 96.4%, and terminal SCR lands at 0.73x against a 1.00x target. Cash-realized outcomes stay strong and OFL gates remain broadly open.

Engine 2026.07.08.1 Run 2026.07.09.1045 Sample from 2021-01-01

What this page shows. Public pages expose the cash-realized scorecard and a curated chart set.

What stays internal. Full canvas diagnostics, telemetry, parameter dumps, and daily series remain behind the internal gate.

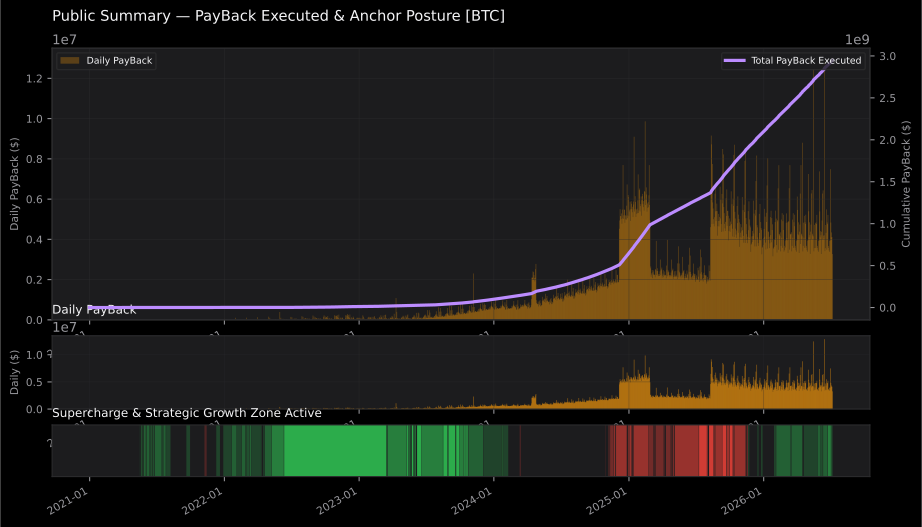
PayBack / Year
$534.5M
annualized over sample window
Total PayBack
$2.95B
cumulative distributions executed
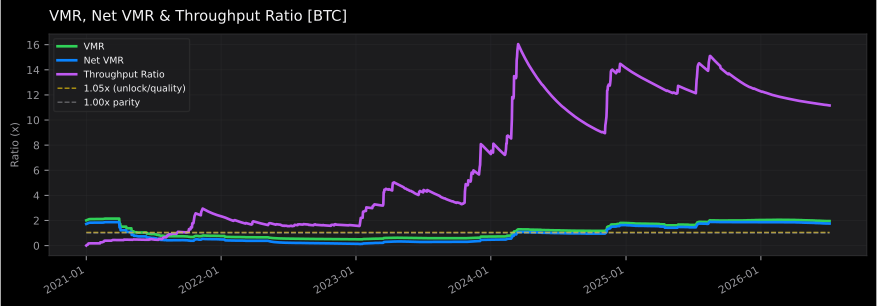
Value Multiplication Ratio
1.95x
headline value creation
Throughput Ratio
11.16x
net throughput / avg protected capital

Key results

Lead with distribution power: how much PayBack was actually delivered, what that implies per year, and only then the supporting efficiency and solvency metrics that explain the result.

PayBack / Year
$534.5M
annualized from sample length
PayBack Executed
$2.95B
funded distributions
Value Multiplication Ratio
1.95x
includes terminal ARCA + ARCI
Throughput Ratio
11.16x
net throughput / avg protected capital
Net VMR
1.76x
cash-realized quality bar
Earned Inflows
$24.53B
earned funding base
Net Throughput
$27.32B
realized protocol throughput
Terminal SCR
0.73x
still shown, but secondary
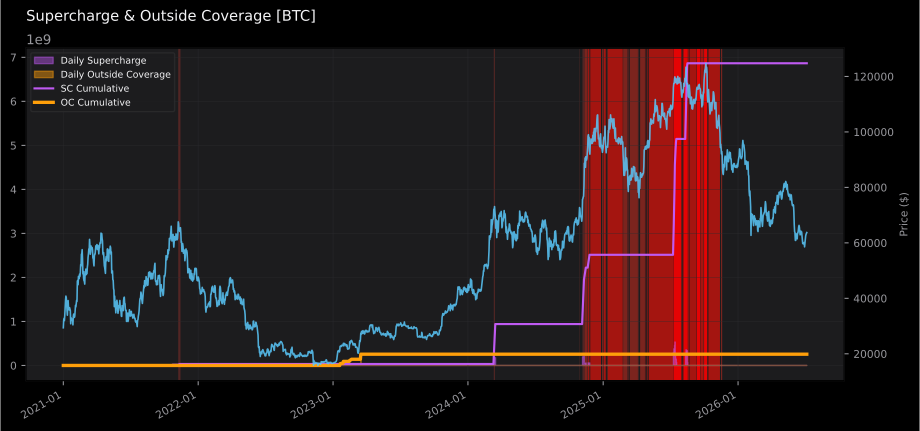
Supercharges
$6.86B
harvested into defense + growth

Interpretation

Solvency Finish
0.73x

Terminal SCR shows where the system finishes after the full multi-year stress sample.

Admission Discipline
96.4%

Gate-open persistence indicates how often OFL growth conditions remained available.

Operational Load
17

Behavior events summarize stress reactions, panic episodes, and recovery interventions.

What stood out

  • PayBack cadence: the run averages $534.5M per year across roughly 5.5 years of history.
  • Total PayBack: $2.95B cumulative distributions were executed during the sample.
  • Readiness: Resilient based on net VMR, terminal SCR, and gate-open persistence.
  • OFL gate openness: 96.4% of sample days kept admission conditions open.
  • Behavior load: 17 behavior events, 7 bear-panic episodes, 1 incident events.
  • Harvest profile: $6.86B realized through supercharges across 39,937 milestones.

Selected trajectories

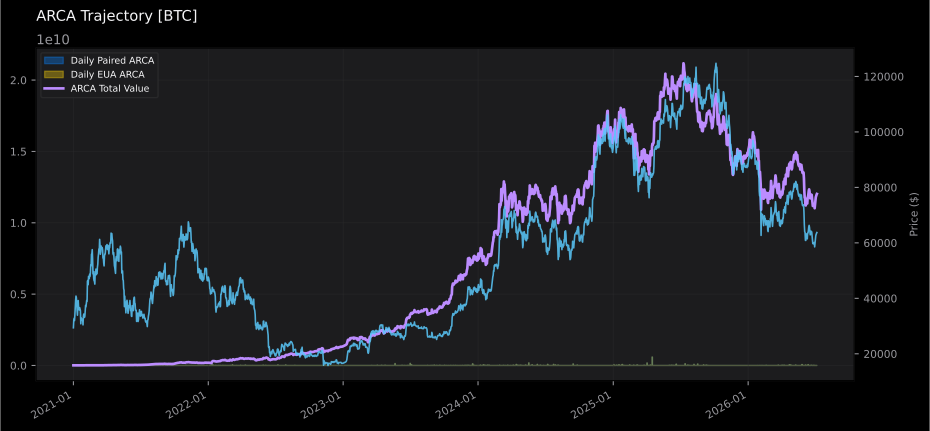
The first chart is the public anchor: cumulative PayBack with daily PayBack activity and separate posture indicators. Supporting charts spell out Value Multiplication Ratio and Throughput Ratio in plain language.
PayBack Executed & Anchor Posture

PayBack Executed & Anchor Posture

ARCA Trajectory

ARCA Trajectory

FCR & SCR

FCR & SCR

VMR & Throughput

VMR & Throughput

Supercharge & Outside Coverage

Supercharge & Outside Coverage