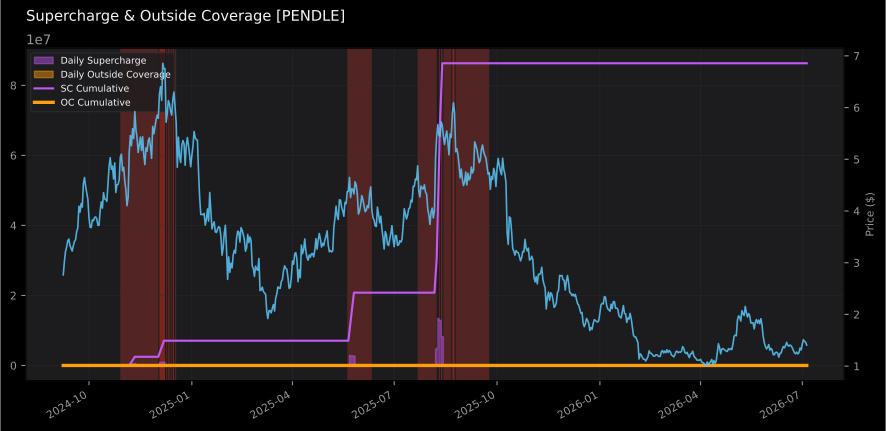
What this page shows. Public pages expose the cash-realized scorecard and a curated chart set.
What stays internal. Full canvas diagnostics, telemetry, parameter dumps, and daily series remain behind the internal gate.
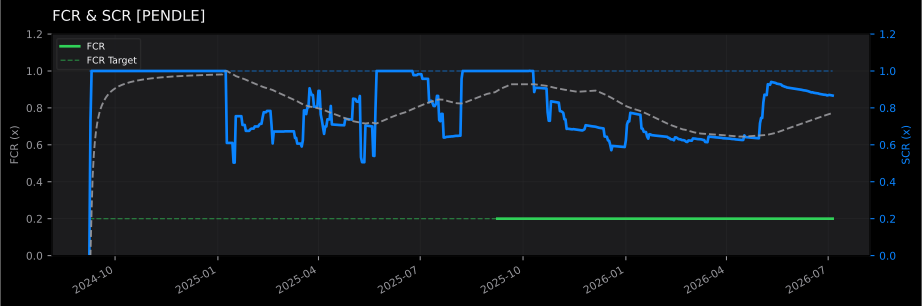
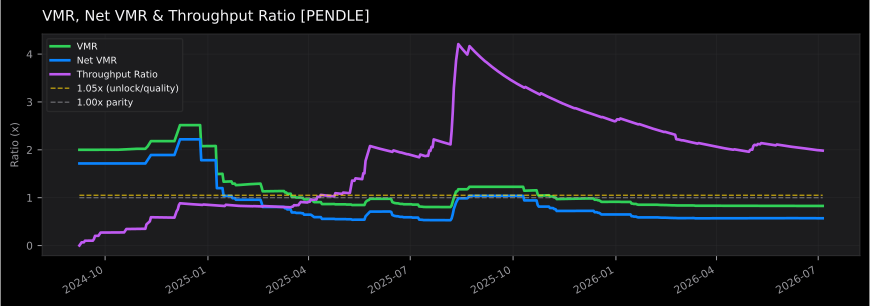
Net VMR closes at 0.57x, the OFL increase gate stays open for 100.0%, and terminal SCR lands at 0.87x against a 1.00x target. This path needs tighter scrutiny before it can be presented as production-grade.
What this page shows. Public pages expose the cash-realized scorecard and a curated chart set.
What stays internal. Full canvas diagnostics, telemetry, parameter dumps, and daily series remain behind the internal gate.
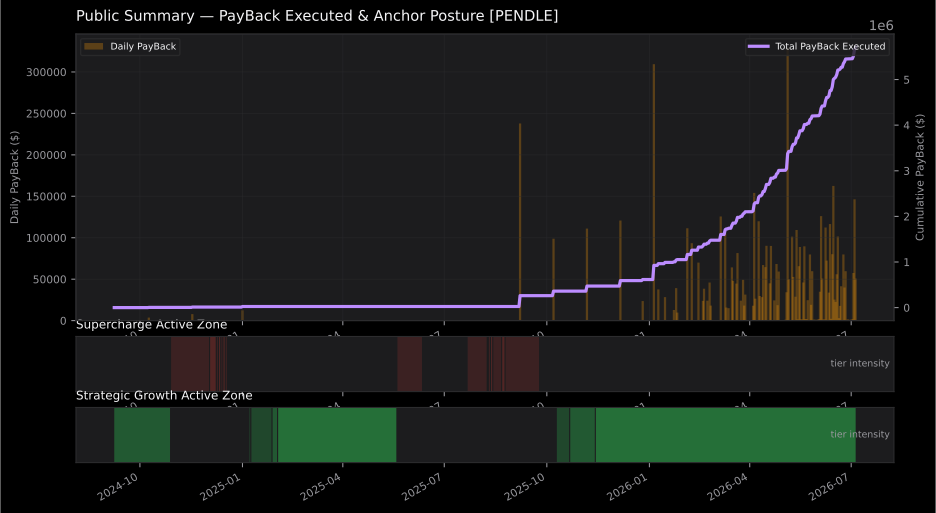
Lead with distribution power: how much PayBack was actually delivered, what that implies per year, and only then the supporting efficiency and solvency metrics that explain the result.
Terminal SCR shows where the system finishes after the full multi-year stress sample.
Gate-open persistence indicates how often OFL growth conditions remained available.
Behavior events summarize stress reactions, panic episodes, and recovery interventions.
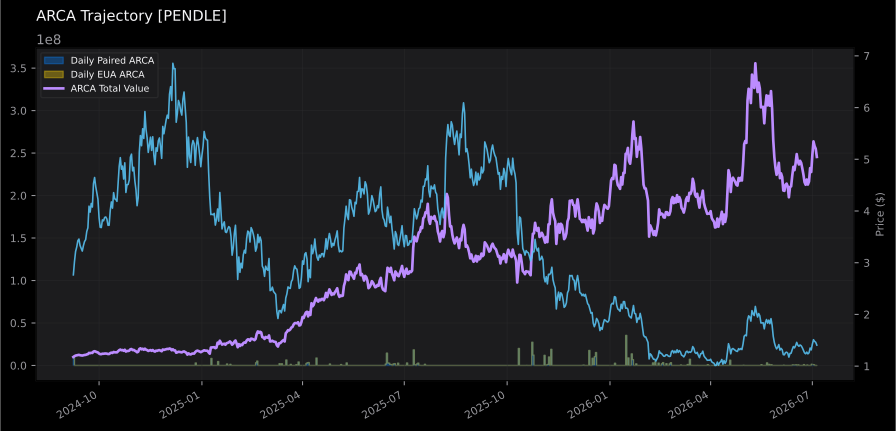
The first chart is the public anchor: cumulative PayBack with daily PayBack activity and separate posture indicators. Supporting charts spell out Value Multiplication Ratio and Throughput Ratio in plain language.