Backtesting
ARC Results Public Engine 2026.07.08.1

Treasury stress tests presented like a real product website.

Public pages should lead with what people can understand immediately: how much PayBack was delivered per year, how much was delivered in total, and then the supporting Value Multiplication Ratio and Throughput Ratio context.

Reading order. Start with PayBack per year, then total PayBack, then Value Multiplication Ratio and Throughput Ratio.

Interpretation. Solvency metrics still matter, but they are supporting context rather than the public headline.

Tracked Assets
6
latest run per asset
Median PayBack / Year
$273.5M
portfolio centerline
Total PayBack
$9.08B
all published assets combined
Best Throughput Ratio
11.16x
top net throughput efficiency
Best Value Multiplication Ratio
2.94x
strongest headline value creation
Filter by asset or class, then re-sort the full-width summaries without rebuilding the site.

Asset summaries

Each asset gets a full-width summary with the PayBack-first chart, plain-language metrics, and a link to the dedicated public page.

BTC

Class A Class A · pure A SC Resilient Run 2026.07.09.1045

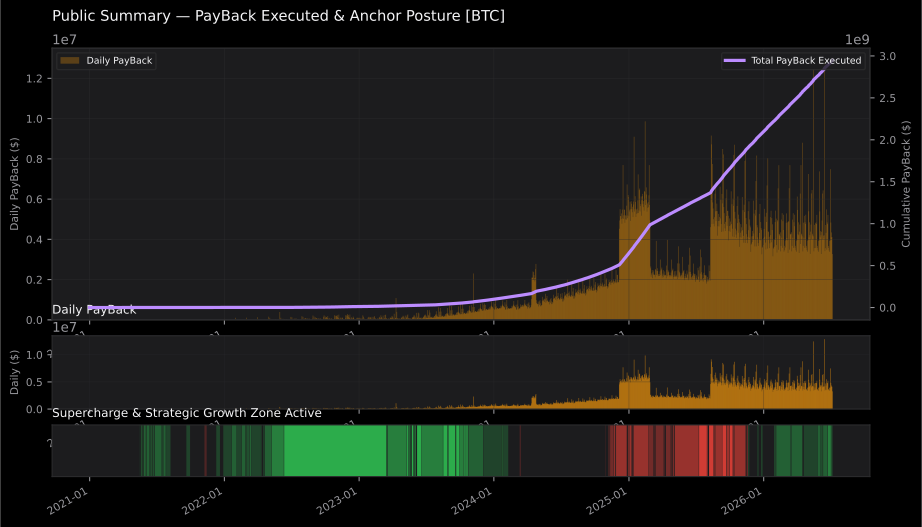
Cash-realized outcomes stay strong and OFL gates remain broadly open.
PayBack / Year
$534.5M
annualized public headline
Total PayBack
$2.95B
cumulative distributions executed
Value Multiplication Ratio
1.95x
spelled out for public readers
Throughput Ratio
11.16x
net throughput / average protected capital
Net VMR
1.76x
cash-realized quality
OFL Gate Open
96.4%
secondary solvency context

ETH

Class A Class A · temp Class F SC Qualified Run 2026.07.09.0906

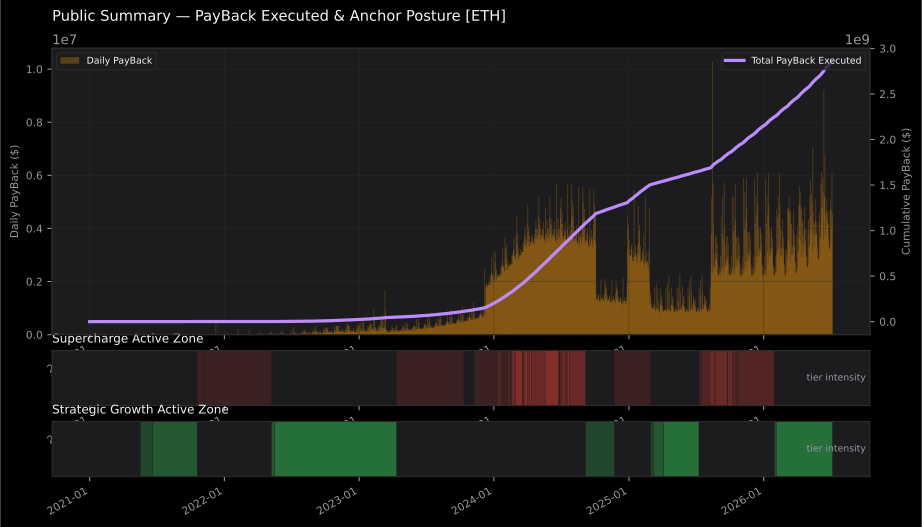
The run clears the cash-realized bar, but solvency headroom still deserves review.
PayBack / Year
$518.9M
annualized public headline
Total PayBack
$2.86B
cumulative distributions executed
Value Multiplication Ratio
1.37x
spelled out for public readers
Throughput Ratio
7.43x
net throughput / average protected capital
Net VMR
1.19x
cash-realized quality
OFL Gate Open
100.0%
secondary solvency context

LINK

Class F Class F · zone SC budget Qualified Run 2026.07.09.0908

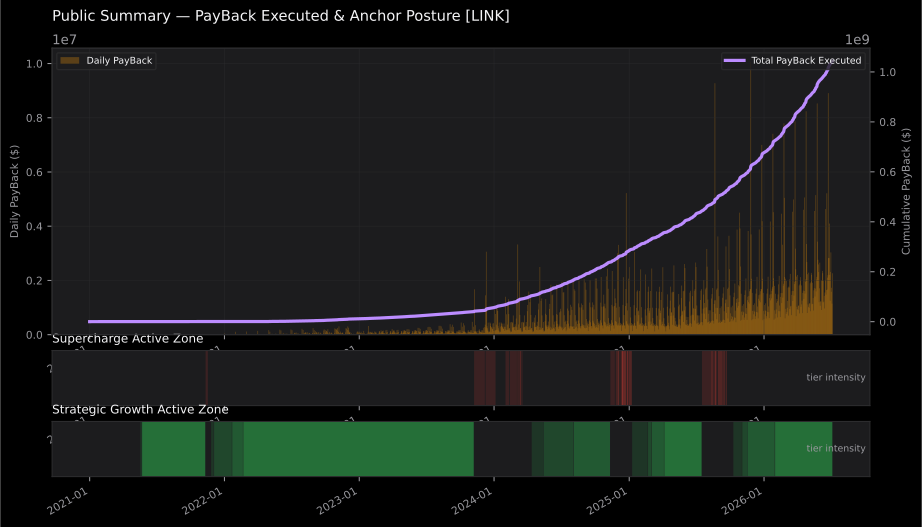
The run clears the cash-realized bar, but solvency headroom still deserves review.
PayBack / Year
$189.4M
annualized public headline
Total PayBack
$1.04B
cumulative distributions executed
Value Multiplication Ratio
1.62x
spelled out for public readers
Throughput Ratio
6.39x
net throughput / average protected capital
Net VMR
1.45x
cash-realized quality
OFL Gate Open
100.0%
secondary solvency context

AAVE

Class F Class F · zone SC budget Qualified Run 2026.07.08.2342

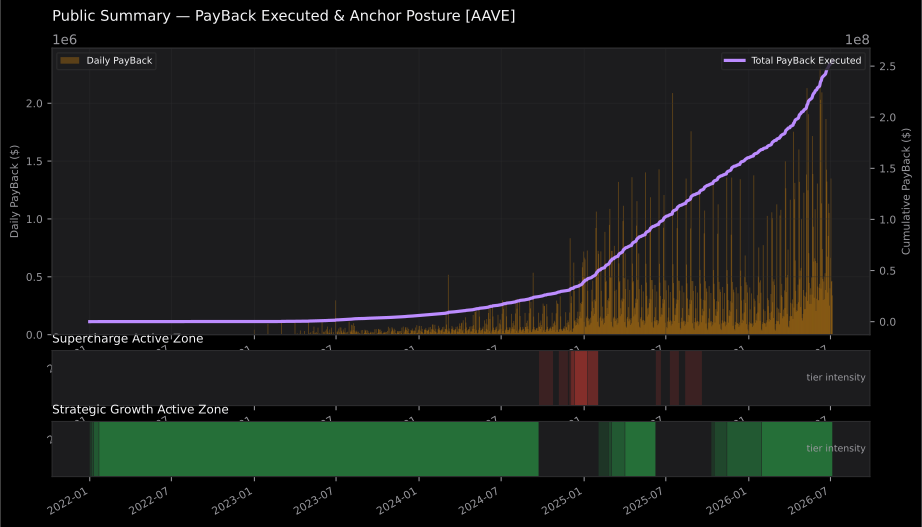
The run clears the cash-realized bar, but solvency headroom still deserves review.
PayBack / Year
$56.5M
annualized public headline
Total PayBack
$254.8M
cumulative distributions executed
Value Multiplication Ratio
1.36x
spelled out for public readers
Throughput Ratio
6.88x
net throughput / average protected capital
Net VMR
1.12x
cash-realized quality
OFL Gate Open
81.4%
secondary solvency context

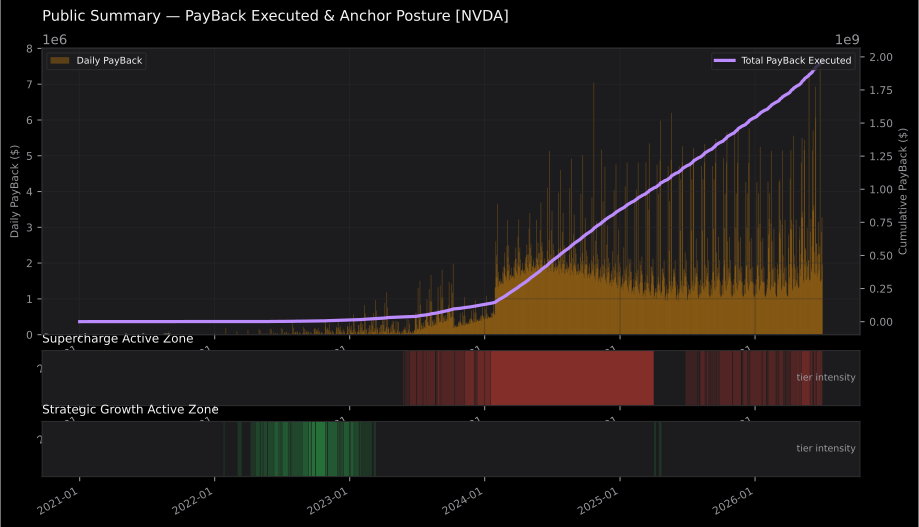
NVDA

Class A Class A · pure A SC Resilient Run 2026.07.08.2252

Cash-realized outcomes stay strong and OFL gates remain broadly open.
PayBack / Year
$357.6M
annualized public headline
Total PayBack
$1.97B
cumulative distributions executed
Value Multiplication Ratio
2.94x
spelled out for public readers
Throughput Ratio
9.37x
net throughput / average protected capital
Net VMR
2.85x
cash-realized quality
OFL Gate Open
100.0%
secondary solvency context

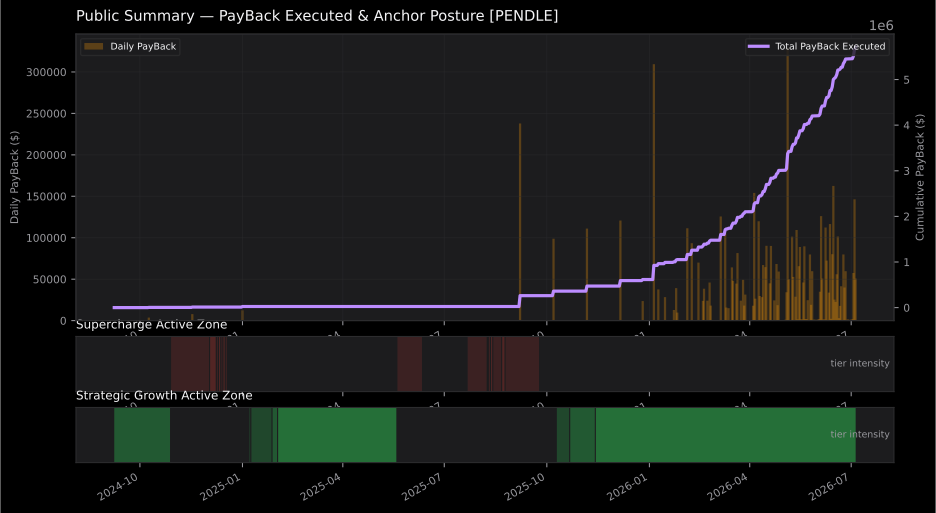
PENDLE

Class F Class F · zone SC budget Fragile Run 2026.07.08.2352

This path needs tighter scrutiny before it can be presented as production-grade.
PayBack / Year
$3.1M
annualized public headline
Total PayBack
$5.7M
cumulative distributions executed
Value Multiplication Ratio
0.83x
spelled out for public readers
Throughput Ratio
1.98x
net throughput / average protected capital
Net VMR
0.57x
cash-realized quality
OFL Gate Open
100.0%
secondary solvency context

Showing latest available run per asset (BTC, ETH, LINK, AAVE, NVDA, PENDLE).

Cross-asset matrix

This table keeps the public ordering explicit: PayBack per year first, total PayBack second, then Value Multiplication Ratio and Throughput Ratio.

Asset PayBack / yr Total PayBack VMR Thr ratio Gate open
BTC
Class A
$534.5M $2.95B 1.95x 11.16x 96.4%
ETH
Class A
$518.9M $2.86B 1.37x 7.43x 100.0%
LINK
Class F
$189.4M $1.04B 1.62x 6.39x 100.0%
AAVE
Class F
$56.5M $254.8M 1.36x 6.88x 81.4%
NVDA
Class A
$357.6M $1.97B 2.94x 9.37x 100.0%
PENDLE
Class F
$3.1M $5.7M 0.83x 1.98x 100.0%